BACK
The Only 3 Charts Plugins You Will Ever Need for Bubble.io Dashboards
Signs of a good chart ⭐️
How long have we all scrolled through the plugins list to find the perfect plugin for a certain chart in a Bubble app? I find there are 3 main signs of the perfect plugin for a certain graph:
Loading Speed
Datasource versatility
Chart types & styling
And for all three purposes, three plugins do it all for me: Charts.js, Air Chart Lite and Gantt / Timeline Chart — vis.js
Let’s see why:
Chart.js — always start with the obvious
If it is not a timeline chart and the data series you want to plot is datatype/option set/data from API, go with charts.js
sometimes the best option is the most obvious one, the only problem with this plugin is the datasource limitation.
Data source limitation
Does not allow basic types like number.
Only displays one series.
for example if you are plotting total daily sales for a month, there will be more than one transaction per day so you’re really plotting sums (number) over time. Which, while doable with some complex expression writing, is not directly an option in this plugin.
But when it comes to styling , it is quite versatile in terms of chart type, colors, BG styling and grid.
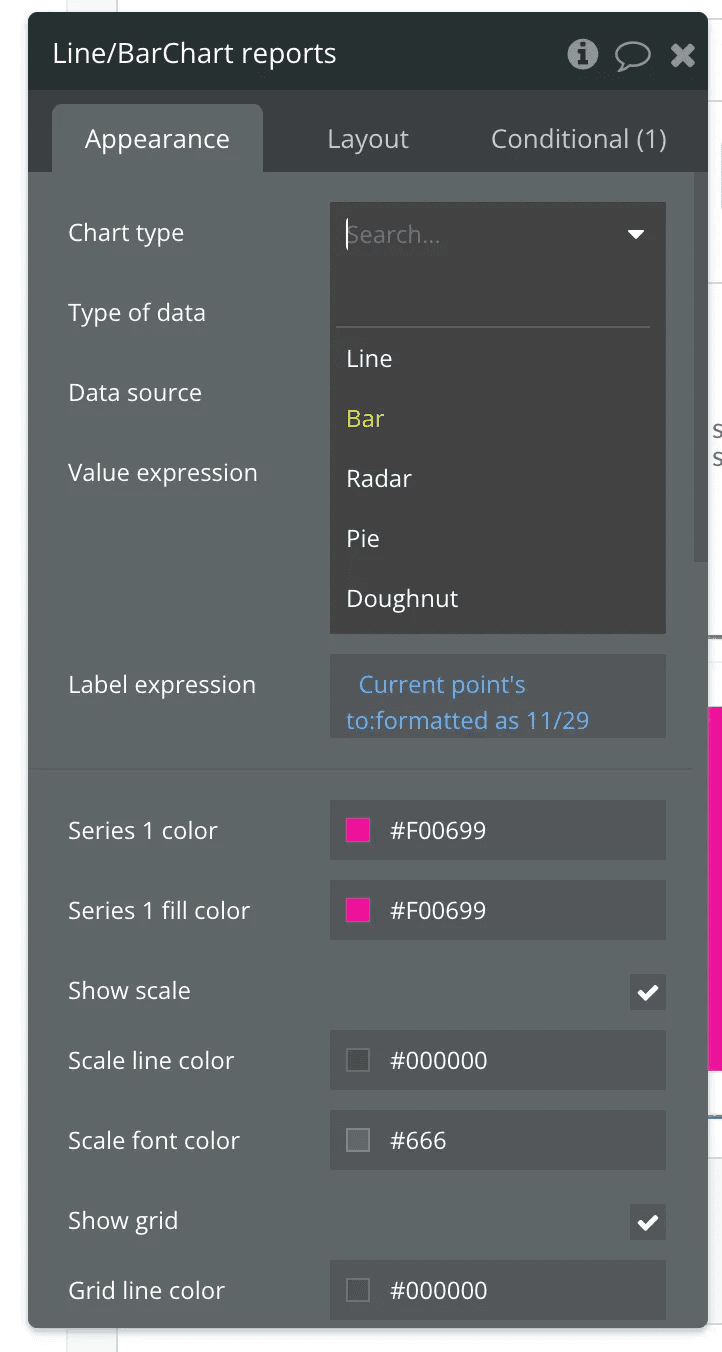
Check out the speed too:
Air Chart Lite — the fairy godmother of all Bubble charts plugins
For ultimate styling and charts with complex expressions in datasource, go with Air Chart Lite.
Now this is the free version of Air Chart Pro by Zeroqode and it is Free and Sublime. There literally is nothing you can’t customize and:
add up to 3 data series in the same chart.
does not require a datatype. You just add the series from any expression like in a spreadsheet.
edit animation.
series color AND range color.
alternating colors.
Data stacking
label trimming & rotation
➡️ you name it, it is there. Only it does not do Gantt or timeline charts. But there’s another plugin for that.

Gantt / Timeline Chart-vis.js — Pricy but blocks time like a charm
If you’re doing a task or project planning interface, go with Gantt/Timeline Chart-vis.js
While it only allows timeline charts, it takes no prisoners when it comes to styling options, responsiveness and interactivity.
There are so many chart-specific events like when a timeline is moved, an item is clicked/double clicked etc. Taking it a bit further, basic workflows like scrolling to a milestone/date, zooming and changing views are predefined for you. All you need is plug your data, style and watch it load!
BONUS: Want ⚡️ fast charts?
One thing I do in my corporate dashboards to make all my charts load fast;
get the basic data(unfiltered) loaded and saved somewhere on page load, so when it is time to display a chart, everything will happen client side, which will save time fetching data on server side.
That works whether your data is on Bubble or somewhere like Airtable or Xano, I tried both ways.
How about you? what charts plugins do you use? please share!
That’s it for now! ‘Till next time, lots of love and #keepbuilding!
More